“Data, data, data. I can’t make bricks without clay!”
Sherlock Holmes
This quote from the fictional detective Sherlock Holmes is a perfect analogy for teaching your students about working with data.
Data are the raw materials from which scientists draw conclusions and develop theories. Data collection and analysis is a large part of every scientist’s career, and data analysis is the tool scientists use to make a claim or support an argument.
As a science teacher, you should ensure that data collection and analysis is a large part of your students’ classroom experience. AP® science exams require students to perform calculations and to visualize and interpret data. NGSS-based formative and summative assessments require students to engage directly with the science and engineering practices, performing calculations, visualizing data, and interpreting statistics. No matter the course level, students must use data to build an argument or support a theory.
Often, the application of math skills is a student’s least favorite part of science. Have you assessed your students’ attitudes toward math? A quick card sort of quotes may give you and your students some insight and help prevent unnecessary anxiety.
The steps below will guide your students to gather and analyze data just as bricklayers use bricks made from clay to build grand structures.
Raw data: the clay
Clay, the raw material for bricks, can vary in color and texture. Similarly, data can vary by type (categorical or continuous) and collection process (field observations or automated probeware), often without consideration given to what data are actually needed and why it’s needed.
To help students connect data to scientific practices, have them return to the investigation question. Ask students:
-
How can you answer the investigation question?
-
What data do you need to answer the question?
The responses to those questions should guide the data collection process, illuminate the tools needed to collect data, and define the variables being tested.
Typically, students should delineate an independent or manipulated variable and a dependent or responding variable. By convention, the independent variable is usually assigned as the X value, and the dependent variable is assigned the Y value.

When collecting raw data, students must be mindful of the accuracy of the instruments they use and the precision of the measurements. A fun way to remind students of these concepts is Carolina’s beanbag toss. The activity will also reinforce the basic descriptive statistics of mean, median, mode, and range.
Data organization: making bricks
Just as a brickmaker forms clay into specified sizes and shapes, students need to arrange data in a specified format that is easy to read and interpret. Students can find themselves completing a series of investigations on a single topic as they would with Carolina Investigations® for AP® Biology: Population Genetics and Evolution Kit.
Consequently, data management becomes cumbersome for many students. Data should always be organized in a chart or table format, identifying variables and units of measure. Remind students to construct data tables before they begin collecting data. With appropriately formatted data tables, they are less likely to lose data or forget the value of a measurement. As the complexity of an experiment or study increases, so does the design of the data table. These examples of table styles are applicable to classroom labs:

Just as well-molded bricks form the foundation of a building, organized data is the foundation for the analysis that follows–first with data visualization through graphing; then descriptive statistics; and possibly, the calculation of an inferential statistical test like a correlation, regression, or chi-square.
Data visualization: laying the brick
In the hands of a mason, pallets of bricks can become an intricate patio, a protective wall, or a grand monument. The pattern in which the bricks are set creates shape, visual interest, and even strength. In the hands of a scientist, identified patterns of data may lead to a cure for a disease, light a city, or feed the world.
The power of data visualization is that students can quickly see trends and relationships among data. Students are expected to correctly construct and interpret graphs in labs and on the exam. All graphs need a descriptive title, labeled axes with units, and both axes scaled correctly and suitably for the data. Students must also be able to determine the correct type of graph–bar, line, or scatter plot–and that decision goes directly back to the type of data collected.
Additional Reading: The Basics of Graphs and Charts
AP® exam readers have pointed out that students generally exhibit good graphing skills but have more difficulty interpreting a graph. Here are a few reminders for students:
-
Slope is a measure of how the variables change with respect to each other. The sentence stem used to elaborate on slope should read something like this: The slope over line segment A is 0.75 units. As variable Y changed 3 units, variable X changed 4 units, which indicates . . .
-
If there are changes in magnitude or sign of the slope, they need to be explained.
-
If time is on the x axis, then the slope of the line is a rate. Examples include births/year = birth rate, product concentration increase/second = reaction rate, or distance traveled/time = speed. The description of the slope should include the term rate.
-
Inflection points, if any, should be called out and explained.
-
Graphs can also be used as predictive tools. Students may be asked to extrapolate or interpolate using a graph. If a test or lab question asks about EXTensions to the data or a prediction of future amounts, then students must EXTrapolate by EXTending the line to get data. If a question requires finding a point that lies withIN the range of the data set, then students must INterpolate.

Graphs and charts are powerful tools for visualizing and comparing data, and students should be adept at both constructing and interpreting them. Working at the college level, AP® science students are expected to complete more extensive data analysis as well. Data transformation through formulas, descriptive statistics, and comparative statistics are tools scientists use to build conclusions and eventually theories.
Data interpretation: using the structure
A big brick patio at a park or restaurant suggests relaxation and fun. A tall brick wall communicates, “stay out!” The formidable brick arches of a grand cathedral instill quiet reverence. Scientific data are interpreted through formulas that some scientists even refer to as elegant and beautiful.
AP® Chemistry, AP® Biology, AP® Physics 1, and AP® Physics 2 courses require data transformation through formulas. Biology students need command of probability calculations and must be able to differentiate between events that are mutually exclusive and those that are independent. Every student should be a master of unit conversions using the conversion factor or dimensional analysis method. Students must communicate to teachers, graders, and each other what their thought processes are by detailing the problem-solving steps they use. A new row of bricks rests upon the prior row. Problem solving begins with identification of what is known and proceeds to a final answer. Remind students that AP® exam readers expect to see:
-
Identification of givens and unknowns with units
-
Selection of the appropriate conversion factor or formula
-
Conversion factor or formula setup with numbers and units
-
Final answer with units
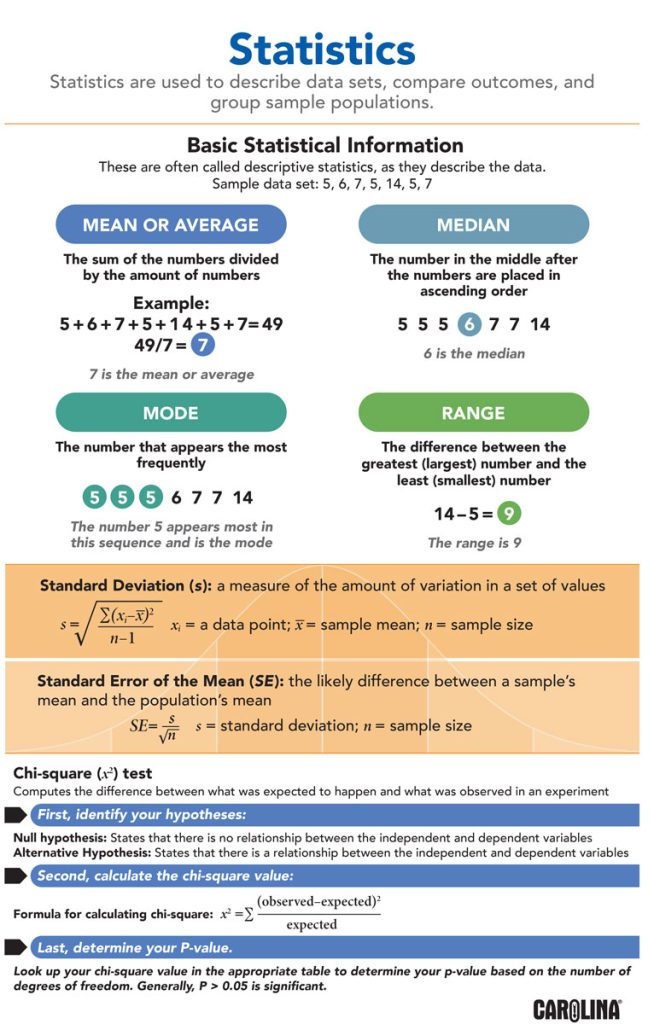
Descriptive statistics serve to describe the data set, or sample, generated in the lab activity. Typically, mean, median, mode, and range are calculated and reported. In some instances, standard error and standard deviations are also helpful in putting the data into context. Biology students are expected to calculate and interpret standard errors and standard deviations. They must also be familiar with the comparative statistic of chi-square, calculating the statistic correctly, and interpreting the value based on the appropriate degrees of freedom and p value.