Prep: 15 mins | Activity: 30-60 mins
There is no doubt that human activities impact the environment. Man-made structures can be seen from space. Night lights imagery from NASA shows locations of people and the infrastructure to support them. Water quality data go back decades and weather data even further.
When you look at the impact humans have on the environment, a number of factors come into play. Data must be available so claims about the impact of human activity can be evaluated and an argument made for continuing, decreasing, modifying, or stopping the activity. Here are a few things to think about:
In this introductory activity, students look at pictures of similar activities to decide what the impacts are to the environment, what data should be collected, and how to collect it. This is a straightforward task at first glance, but it gets convoluted as students begin to ask more detailed questions about impacts and the data necessary to support a claim. A discussion of the phenomenon below sets the parameters for how much detail you want students to include.
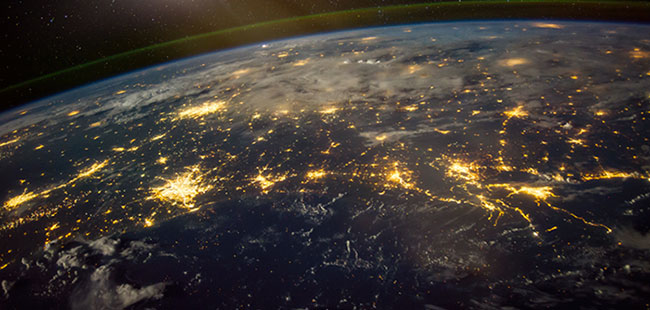
Show students the picture below of the US Gulf Coast at night. The southeast Texas coast is on the left side of the picture; Houston is the largest lighted area. The Mississippi Delta, and New Orleans, is to the right. Students may pick out light from oil rigs in the Gulf. Note that the atmosphere boundary is visible at the top of the picture.
Ask students what they see and to think about human impact on a global scale. What do they need to know to determine how human activities impact the planet? Discuss their thoughts as a class or in a small group setting before beginning the activity. This is a good place to frame your expectations for the scope of questions asked and types of data collected as students analyze the pictures of human activities.
What information is necessary to design a solution that reduces the impacts of human activities?
HS-LS2-7. Design, evaluate, and refine a solution for reducing the impacts of human activities on the environment and biodiversity.
HS-ESS3-4. Evaluate or refine a technological solution that reduces impacts of human activities on natural systems.
Constructing Explanations and Designing Solutions
LS2.C: Ecosystem Dynamics, Functioning, and Resilience
ESS3.C: Human Impacts on Earth Systems
ETS1.B: Developing Possible Solutions
Stability and Change
No PPE is required for the activity.
Copy the student pages or upload to a class webpage.
Representation of possible student questions, ideas, and inferences. Remind students that these questions and ideas are meant to drive decisions on what data needs to be collected before designing a solution to a problem.
Human Activities
Student Response
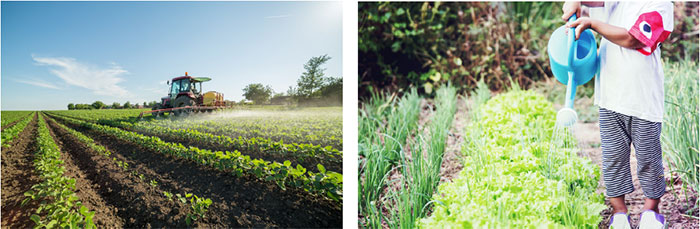
Large scale monoculture, probably a heavy reliance on fertilizers and pesticides, highly regulated, must have runoff mitigation.
Small family garden. No regulations on type and quantity of fertilizers, amount of water, soil erosion
Questions-what’s being done to protect the land, local ecosystem, water quality. Does the amount of food produced justify the land use? What was cleared/disturbed to make the fields? How much “energy” goes into producing the crop?
Student Response
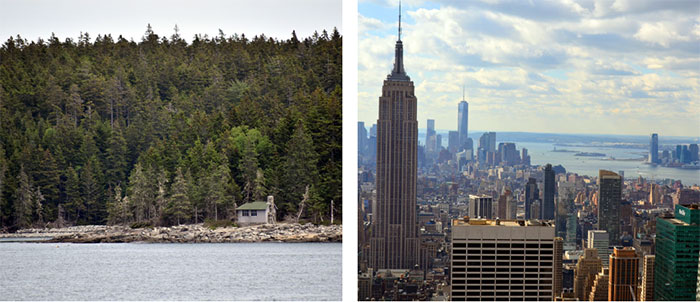
How are goods and services delivered? How much land does it take per person to live under both conditions? How is waste dealt with? What impact is there on the water quality? What is the cost to the environment for transportation, electricity, heat, food, etc.?
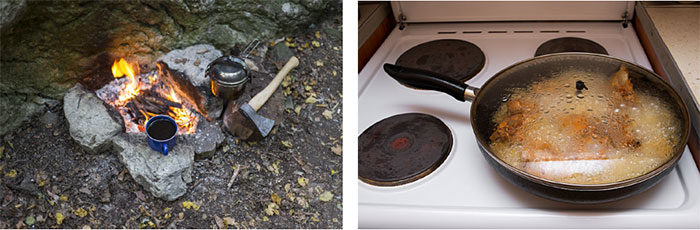
Student Response
What’s the long term and short-term environmental damage to produce energy to cook food? How is the energy transported? What if the open flame starts a forest fire?
Student Response
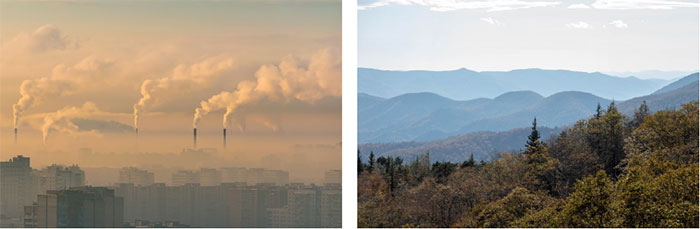
The sky in both pictures looks hazy. What’s causing the haze over the mountains? Does air pollution travel? Is the haze a natural phenomenon? What is sunlight doing to the exhaust? Is the air healthy to breathe?
Student answers will vary based on individual contributions. At this point, you may want to have all the groups share their consensus results, then have a whole class discussion and decide, as a class, what the critical criteria are when designing a solution addressing the impacts of human activities. What should be included on the final Human Impacts Assessment form?
Discuss whether the form should use qualitative data, quantitative data, or both. Will the form look like a Likert Scale? How will data be represented: numerical values, percent, graphical, tabular, pictorial?
At this point, decide if you would like one Human Impacts Assessment form, one per group, or individual forms. As topics with human impacts arise, use the student generated form to assess the impacts of human activities. They may find the form needs revising to account for variables that weren’t discussed earlier. The generation and revision process engages students in a number of science and engineering practices, obviously applicable to all science disciplines and to disciplines in the social sciences.
*Next Generation Science Standards® is a registered trademark of Achieve. Neither Achieve nor the lead states and partners that developed the Next Generation Science Standards were involved in the production of, and do not endorse, these products.
Sign up for free resources delivered to your inbox!